Dental Assistant Salary in Massachusetts: $58,280 (2026)
Quick Answer:Across Massachusetts's 59 metropolitan areas, the average median dental assistant pay sits at $58,280/year heading into 2026 — a figure projected from 2025 BLS OEWS wage data for SOC 31-9091. Because Massachusetts sits at BEA RPP 108.5 (9% above the U.S. baseline), that statewide median translates to roughly $53,714 in nationally-comparable purchasing power. Highest-paying metros: Boston ($58,160), Barnstable Town ($58,080), Newton ($57,692).
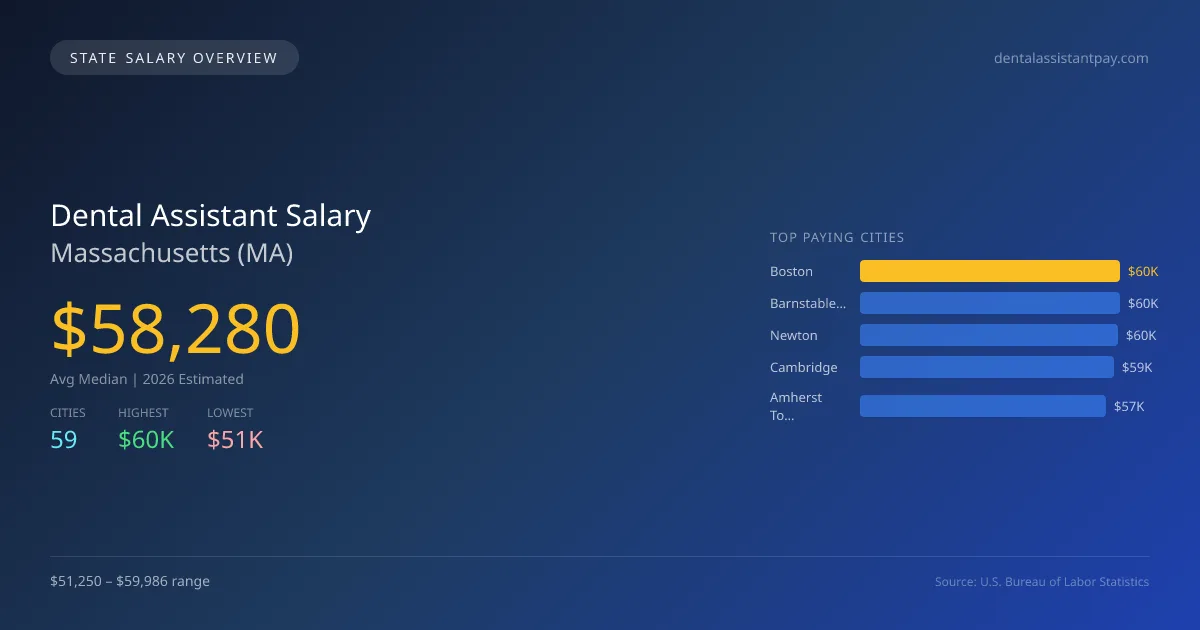
The projected average median salary for dental assistants in Massachusetts in 2026 is $58,279, significantly higher than the national median of $49,579, reflecting a difference of 17.5%. This favorable compensation is particularly evident in metropolitan areas, with Boston offering the highest salaries at $59,986, while Springfield represents the lower end at $51,250. The salary gap primarily arises from varying local demand for dental services, cost of living differences, and competition among practices. In Massachusetts, dental assistants must fulfill specific state licensing requirements and adhere to distinct scope of practice laws, which can influence salary levels based on certification and experience. The job market for dental assistants in the state is expected to grow at an annual rate of 3.14%, driven by an increasing population and a higher demand for dental services. Top-paying cities like Barnstable Town at $59,904 and Newton at $59,504 demonstrate a concentration of dental practices, while cities further from urban centers, such as Amherst Town at $56,696, typically offer lower wages. Overall, the strong outlook for dental assistant opportunities in Massachusetts supports a favorable context for job seekers in the field.
Massachusetts Dental Assistant Salary Range
Overall salary range in Massachusetts: $39,830 (lowest entry-level) to $77,689 (highest top earner)
Massachusetts vs National Average
Massachusetts dental assistants earn 17.55% more than the national median (+$8,701/year difference).
Massachusetts Dental Assistant Salary Distribution (2026)
Dental Assistant salaries in Massachusetts range from $47,566 (entry-level, 10th percentile) to $72,378 (top earners, 90th percentile), with a median of $58,280. The Massachusetts median is $8,701 above the US national median of $49,579. The average hourly rate is $28.02/hr. Approximately 9,797 dental assistants are employed across 59 cities.
2019 BLS Actual
$48,939
2025 BLS Actual
$56,505
2026 Current Est.
$58,280
2019–2027 Growth
+22.8%
Salary Trajectory for Dental Assistants in Massachusetts (2019–2027)
2019–2025: actual BLS OEWS data for this metro area. 2026+: CAGR 3.14% projection.
| Year | Annual Salary | Status |
|---|---|---|
| 2019 | $48,939 | Actual |
| 2020 | $51,267 | Actual |
| 2021 | $47,823 | Actual |
| 2022 | $53,224 | Actual |
| 2023 | $58,227 | Actual |
| 2024 | $56,576 | Actual |
| 2025 | $56,505 | Actual |
| 2026(current) | $58,280 | Estimated |
| 2027 | $60,110 | Projected |
Based on 7 years of BLS OEWS data for the Massachusetts metropolitan area, the median dental assistant salary grew 15.5% from $48,939 (2019) to $56,505 (2025). At a 3.14% compound annual growth rate, salaries are projected to reach $60,110 by 2027 — a total increase of $11,171 (22.83%) from 2019.
Note: Historical values (2019–2025) are actual BLS OEWS figures for the Massachusetts metropolitan area, sourced from annual Occupational Employment and Wage Statistics surveys. 2026–2026 figures are current estimates, and 2027 values are projections, calculated using a 3.14% CAGR derived from 7-year BLS historical data. Actual salaries may vary based on employer, experience, certifications, and local market conditions.
Top 5 Highest Paying Cities in Massachusetts
Lowest Paying Cities in Massachusetts
| City | Median Salary |
|---|---|
| Springfield | $51,250 |
| Andover | $51,973 |
| Leominster | $52,101 |
| Wellesley | $52,148 |
| Chelmsford | $52,177 |
Best Value Cities for Dental Assistants in Massachusetts
When adjusted for local cost of living, these Massachusetts cities offer the most purchasing power for dental assistants.
| City | Nominal Salary | CoL Index | Adjusted Salary |
|---|---|---|---|
| Barnstable Town | $59,904 | 98.351 | $60,908 |
| Amherst Town | $56,696 | 100.243 | $56,559 |
| Pittsfield | $53,086 | 95.106 | $55,818 |
| Boston | $59,986 | 108.266 | $55,406 |
| Newton | $59,504 | 108.5 | $54,842 |
Adjusted salary = nominal salary × (100 / CoL index). CoL index: 100 = national average. Lower index = lower cost of living.
Salary by Experience Level in Massachusetts
| Experience Level | Estimated Annual |
|---|---|
| Entry Level (0-2 years) | $47,566 |
| Mid Career (3-7 years) | $58,280 |
| Experienced (7+ years) | $72,378 |
Estimates based on BLS percentile data averaged across Massachusetts metro areas. Individual pay varies by employer, certifications, and specialization.
All 59 Cities in Massachusetts
| # | City | Median Salary |
|---|---|---|
| 1 | Boston | $59,986 |
| 2 | Barnstable Town | $59,904 |
| 3 | Newton | $59,504 |
| 4 | Cambridge | $58,554 |
| 5 | Amherst Town | $56,696 |
| 6 | Lynn | $56,378 |
| 7 | Northampton | $55,945 |
| 8 | Somerville | $55,640 |
| 9 | Revere | $55,553 |
| 10 | Brockton | $55,362 |
| 11 | New Bedford | $55,301 |
| 12 | Plymouth | $55,266 |
| 13 | Malden | $55,066 |
| 14 | Haverhill | $55,057 |
| 15 | Lowell | $55,043 |
| 16 | Framingham | $55,018 |
| 17 | Peabody | $54,945 |
| 18 | Weymouth | $54,779 |
| 19 | Chicopee | $54,614 |
| 20 | Randolph | $54,554 |
| 21 | Quincy | $54,458 |
| 22 | Amherst | $54,392 |
| 23 | Chelsea | $54,388 |
| 24 | Medford | $54,240 |
| 25 | Fall River | $54,188 |
| 26 | Marlborough | $54,188 |
| 27 | Watertown | $54,179 |
| 28 | Fitchburg | $54,137 |
| 29 | Methuen | $54,117 |
| 30 | Taunton | $54,092 |
| 31 | Arlington | $54,073 |
| 32 | Needham | $53,932 |
| 33 | Westfield | $53,907 |
| 34 | Everett | $53,898 |
| 35 | Holyoke | $53,621 |
| 36 | Lawrence | $53,532 |
| 37 | Beverly | $53,532 |
| 38 | Dartmouth | $53,468 |
| 39 | Waltham | $53,414 |
| 40 | Barnstable | $53,357 |
| 41 | Brookline | $53,240 |
| 42 | Billerica | $53,157 |
| 43 | Pittsfield | $53,086 |
| 44 | Braintree | $52,978 |
| 45 | Salem | $52,889 |
| 46 | Natick | $52,855 |
| 47 | Dracut | $52,578 |
| 48 | Lexington | $52,544 |
| 49 | Stoughton | $52,544 |
| 50 | Shrewsbury | $52,476 |
| 51 | Franklin | $52,335 |
| 52 | Worcester | $52,313 |
| 53 | Attleboro | $52,292 |
| 54 | Woburn | $52,224 |
| 55 | Chelmsford | $52,177 |
| 56 | Wellesley | $52,148 |
| 57 | Leominster | $52,101 |
| 58 | Andover | $51,973 |
| 59 | Springfield | $51,250 |
More Massachusetts Salary Data
Hourly Rates
Explore dental assistant hourly pay in Massachusetts cities.
Senior / Experienced
Top earner salaries for experienced dental assistants.
Compare Cities in Massachusetts
View all comparisons →Explore More Dental Assistant Salary Data
Frequently Asked Questions
How much do dental assistants make in Massachusetts in 2026?
What is the highest paying city for dental assistants in Massachusetts?
How does Massachusetts dental assistant pay compare to the national average?
What is the entry-level dental assistant salary in Massachusetts?
How many dental assistants are employed in Massachusetts?
Which Massachusetts city offers the best value for dental assistants?
Written by Maria Gonzalez, CDA, RDH
Career Analyst
Maria Gonzalez has over 10 years of experience in dental assisting. She specializes in pediatric dentistry. She works in a private dental practice.
Methodology & Data Source
Statewide salary figures on this page are 2026 projections based on the Bureau of Labor Statistics Occupational Employment and Wage Statistics (OEWS) survey, May 2026 release. A 3.14% compound annual growth rate (CAGR), derived from 6-year national BLS wage trends, was applied to each metro area's reported salary to estimate current 2026 dental assistant compensation across Massachusetts. State averages are employment-weighted across 59 metro areas — larger metro areas with more dental assistantscontribute proportionally more to the average, producing figures that better reflect typical compensation. Individual pay varies by city, employer, certifications, and experience.
Data Sources & Methodology
Source: BLS, OEWS, 7-year dataset (–). Per-city data from annual BLS metropolitan area surveys.
2026 figures are projected from 2025 BLS data using a compound annual growth rate (CAGR) of 3.14%, derived from historical BLS wage trends for dental assistants (SOC 31-9091).
Compiled and verified by Maria Gonzalez, CDA, RDH, a licensed dental assistant with 10+ years of clinical experience. · View source data at BLS.gov