Dental Assistant Salary in Illinois: $49,994 (2026)
Quick Answer:Across Illinois's 65 metropolitan areas, the average median dental assistant pay sits at $49,994/year heading into 2026 — a figure projected from 2025 BLS OEWS wage data for SOC 31-9091. Because Illinois sits at BEA RPP 97.1 (3% below the U.S. baseline), that statewide median translates to roughly $51,487 in nationally-comparable purchasing power. Highest-paying metros: Naperville ($49,461), Chicago ($48,950), Elgin ($48,513).
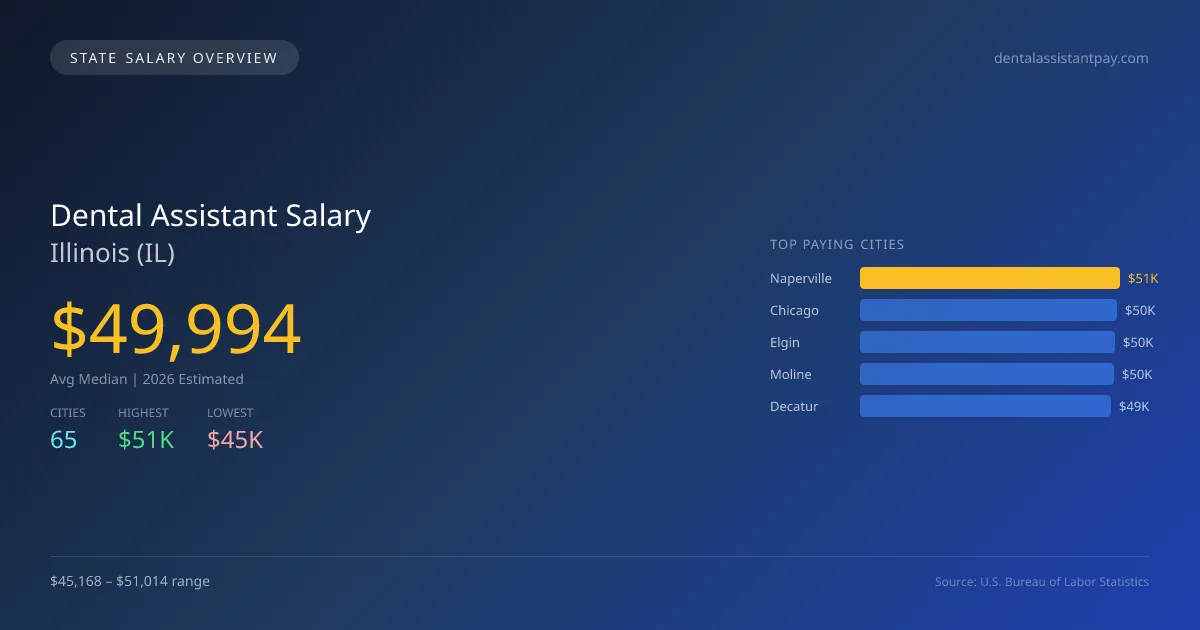
In 2026, the average median salary for dental assistants in Illinois is projected to be $49,994, slightly higher than the national median of $49,579, representing a 0.8% increase. Salary variations exist within the state, with Naperville offering the highest average salary of $51,014, while Carbondale has the lowest at $45,168, resulting in a salary gap of $5,846. This difference can be attributed to factors such as cost of living, demand for dental services, and local competition among dental practices. Illinois has specific licensing requirements and defined scope of practice laws that can influence salaries and job roles. The demand for dental assistants in the state is also driven by a growing population and increased awareness of oral health. The overall job market appears strong, with an employment projection of 12,731 dental assistants and a growth rate of 3.14% annually. In terms of top paying cities, Chicago ($50,487), Elgin ($50,036), Moline ($49,765), and Decatur ($49,270) follow closely behind Naperville, indicating a steady demand across urban areas in Illinois. These figures illustrate the promising landscape for dental assistants in the state through 2026.
Illinois Dental Assistant Salary Range
Overall salary range in Illinois: $34,930 (lowest entry-level) to $69,728 (highest top earner)
Illinois vs National Average
Illinois dental assistants earn 0.84% more than the national median (+$415/year difference).
Illinois Dental Assistant Salary Distribution (2026)
Dental Assistant salaries in Illinois range from $39,671 (entry-level, 10th percentile) to $62,659 (top earners, 90th percentile), with a median of $49,994. The Illinois median is $415 above the US national median of $49,579. The average hourly rate is $24.03/hr. Approximately 12,731 dental assistants are employed across 65 cities.
2019 BLS Actual
$40,810
2025 BLS Actual
$48,472
2026 Current Est.
$49,994
2019–2027 Growth
+26.4%
Salary Trajectory for Dental Assistants in Illinois (2019–2027)
2019–2025: actual BLS OEWS data for this metro area. 2026+: CAGR 3.14% projection.
| Year | Annual Salary | Status |
|---|---|---|
| 2019 | $40,810 | Actual |
| 2020 | $41,521 | Actual |
| 2021 | $45,438 | Actual |
| 2022 | $38,966 | Actual |
| 2023 | $43,377 | Actual |
| 2024 | $47,142 | Actual |
| 2025 | $48,472 | Actual |
| 2026(current) | $49,994 | Estimated |
| 2027 | $51,564 | Projected |
Based on 7 years of BLS OEWS data for the Illinois metropolitan area, the median dental assistant salary grew 18.8% from $40,810 (2019) to $48,472 (2025). At a 3.14% compound annual growth rate, salaries are projected to reach $51,564 by 2027 — a total increase of $10,754 (26.35%) from 2019.
Note: Historical values (2019–2025) are actual BLS OEWS figures for the Illinois metropolitan area, sourced from annual Occupational Employment and Wage Statistics surveys. 2026–2026 figures are current estimates, and 2027 values are projections, calculated using a 3.14% CAGR derived from 7-year BLS historical data. Actual salaries may vary based on employer, experience, certifications, and local market conditions.
Top 5 Highest Paying Cities in Illinois
Lowest Paying Cities in Illinois
| City | Median Salary |
|---|---|
| Carbondale | $45,168 |
| Elmhurst | $45,618 |
| Calumet City | $45,730 |
| Galesburg | $45,746 |
| Crystal Lake | $45,921 |
Best Value Cities for Dental Assistants in Illinois
When adjusted for local cost of living, these Illinois cities offer the most purchasing power for dental assistants.
| City | Nominal Salary | CoL Index | Adjusted Salary |
|---|---|---|---|
| Decatur | $49,270 | 88.422 | $55,721 |
| Peoria | $48,765 | 91.231 | $53,452 |
| Naperville | $51,014 | 97.1 | $52,538 |
| Champaign | $48,600 | 92.704 | $52,425 |
| Elgin | $50,036 | 97.1 | $51,530 |
Adjusted salary = nominal salary × (100 / CoL index). CoL index: 100 = national average. Lower index = lower cost of living.
Salary by Experience Level in Illinois
| Experience Level | Estimated Annual |
|---|---|
| Entry Level (0-2 years) | $39,671 |
| Mid Career (3-7 years) | $49,994 |
| Experienced (7+ years) | $62,659 |
Estimates based on BLS percentile data averaged across Illinois metro areas. Individual pay varies by employer, certifications, and specialization.
All 65 Cities in Illinois
More Illinois Salary Data
Senior / Experienced
Top earner salaries for experienced dental assistants.
Compare Cities in Illinois
View all comparisons →Explore More Dental Assistant Salary Data
Frequently Asked Questions
How much do dental assistants make in Illinois in 2026?
What is the highest paying city for dental assistants in Illinois?
How does Illinois dental assistant pay compare to the national average?
What is the entry-level dental assistant salary in Illinois?
How many dental assistants are employed in Illinois?
Which Illinois city offers the best value for dental assistants?
Written by Maria Gonzalez, CDA, RDH
Career Analyst
Maria Gonzalez has over 10 years of experience in dental assisting. She specializes in pediatric dentistry. She works in a private dental practice.
Methodology & Data Source
Statewide salary figures on this page are 2026 projections based on the Bureau of Labor Statistics Occupational Employment and Wage Statistics (OEWS) survey, May 2026 release. A 3.14% compound annual growth rate (CAGR), derived from 6-year national BLS wage trends, was applied to each metro area's reported salary to estimate current 2026 dental assistant compensation across Illinois. State averages are employment-weighted across 65 metro areas — larger metro areas with more dental assistantscontribute proportionally more to the average, producing figures that better reflect typical compensation. Individual pay varies by city, employer, certifications, and experience.
Data Sources & Methodology
Source: BLS, OEWS, 7-year dataset (–). Per-city data from annual BLS metropolitan area surveys.
2026 figures are projected from 2025 BLS data using a compound annual growth rate (CAGR) of 3.14%, derived from historical BLS wage trends for dental assistants (SOC 31-9091).
Compiled and verified by Maria Gonzalez, CDA, RDH, a licensed dental assistant with 10+ years of clinical experience. · View source data at BLS.gov