Dental Assistant Salary in California: $55,286 (2026)
Quick Answer:Across California's 158 metropolitan areas, the average median dental assistant pay sits at $55,286/year heading into 2026 — a figure projected from 2025 BLS OEWS wage data for SOC 31-9091. Because California sits at BEA RPP 113.1 (13% above the U.S. baseline), that statewide median translates to roughly $48,882 in nationally-comparable purchasing power. Highest-paying metros: Sunnyvale ($76,352), Santa Clara ($75,850), San Jose ($74,600).
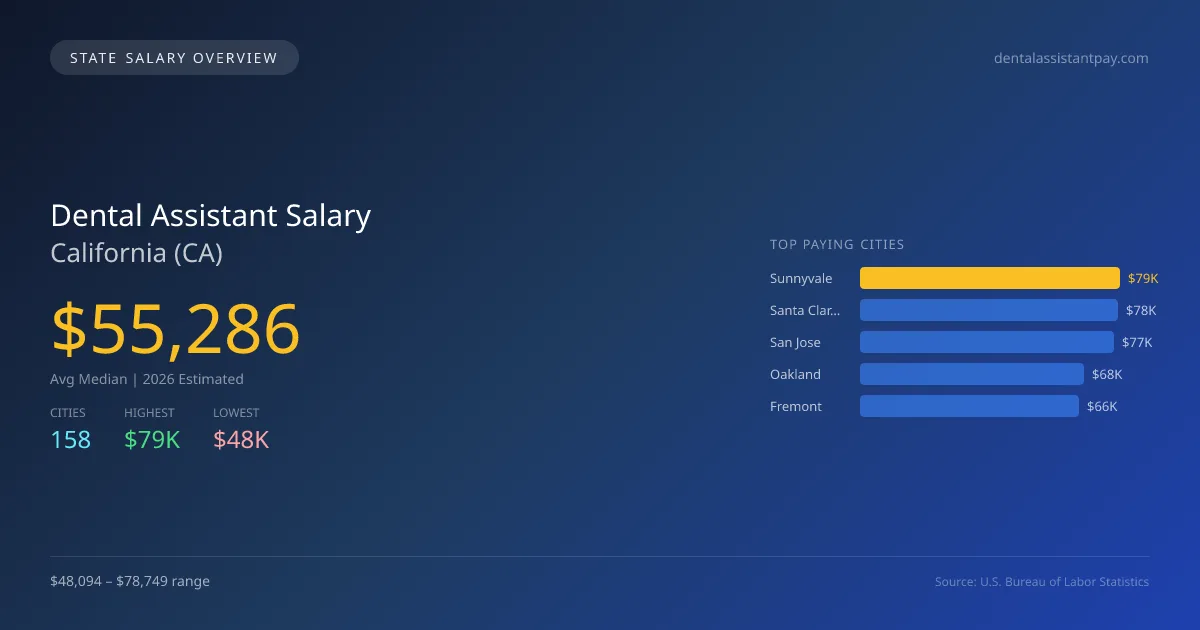
In 2026, dental assistants in California can expect an average median salary of $55,286, which exceeds the national median of $49,579 by 11.5%. This higher pay reflects the state's cost of living and demand for qualified professionals. The salary difference between the highest-paying city, Sunnyvale at $78,749, and the lowest-paying city, Visalia at $48,094, underscores regional economic disparities and supply-demand dynamics. Factors contributing to these variations include local market conditions, dental care needs, and the concentration of dental practices in urban areas. California's licensing requirements for dental assistants can also influence earnings, as they often require additional schooling and certification that can increase a candidate's market value. The scope of practice laws provide dental assistants the ability to perform various tasks, enhancing their importance within dental teams. The job market for dental assistants in California is projected to grow at an annual rate of 3.14%, indicating steady demand for this role. With a total employment of 57,729 dental assistants, opportunities are anticipated to arise, particularly in areas like Sunnyvale, Santa Clara, and San Jose, where salaries are among the highest in the state.
California Dental Assistant Salary Range
Overall salary range in California: $34,268 (lowest entry-level) to $104,836 (highest top earner)
California vs National Average
California dental assistants earn 11.51% more than the national median (+$5,707/year difference).
California Dental Assistant Salary Distribution (2026)
Dental Assistant salaries in California range from $43,005 (entry-level, 10th percentile) to $67,817 (top earners, 90th percentile), with a median of $55,286. The California median is $5,707 above the US national median of $49,579. The average hourly rate is $26.58/hr. Approximately 57,729 dental assistants are employed across 158 cities.
2019 BLS Actual
$42,043
2025 BLS Actual
$53,603
2026 Current Est.
$55,286
2019–2027 Growth
+35.6%
Salary Trajectory for Dental Assistants in California (2019–2027)
2019–2025: actual BLS OEWS data for this metro area. 2026+: CAGR 3.14% projection.
| Year | Annual Salary | Status |
|---|---|---|
| 2019 | $42,043 | Actual |
| 2020 | $43,970 | Actual |
| 2021 | $47,269 | Actual |
| 2022 | $48,996 | Actual |
| 2023 | $51,417 | Actual |
| 2024 | $52,080 | Actual |
| 2025 | $53,603 | Actual |
| 2026(current) | $55,286 | Estimated |
| 2027 | $57,022 | Projected |
Based on 7 years of BLS OEWS data for the California metropolitan area, the median dental assistant salary grew 27.5% from $42,043 (2019) to $53,603 (2025). At a 3.14% compound annual growth rate, salaries are projected to reach $57,022 by 2027 — a total increase of $14,979 (35.63%) from 2019.
Note: Historical values (2019–2025) are actual BLS OEWS figures for the California metropolitan area, sourced from annual Occupational Employment and Wage Statistics surveys. 2026–2026 figures are current estimates, and 2027 values are projections, calculated using a 3.14% CAGR derived from 7-year BLS historical data. Actual salaries may vary based on employer, experience, certifications, and local market conditions.
Top 5 Highest Paying Cities in California
Lowest Paying Cities in California
| City | Median Salary |
|---|---|
| Visalia | $48,094 |
| Los Angeles | $48,373 |
| Long Beach | $48,534 |
| Anaheim | $49,234 |
| Bakersfield | $49,610 |
Best Value Cities for Dental Assistants in California
When adjusted for local cost of living, these California cities offer the most purchasing power for dental assistants.
| City | Nominal Salary | CoL Index | Adjusted Salary |
|---|---|---|---|
| San Jose | $76,942 | 110.423 | $69,679 |
| Sunnyvale | $78,749 | 113.1 | $69,628 |
| Santa Clara | $78,232 | 113.1 | $69,171 |
| El Centro | $57,810 | 95.174 | $60,741 |
| Oakland | $67,924 | 113.1 | $60,057 |
Adjusted salary = nominal salary × (100 / CoL index). CoL index: 100 = national average. Lower index = lower cost of living.
Salary by Experience Level in California
| Experience Level | Estimated Annual |
|---|---|
| Entry Level (0-2 years) | $43,005 |
| Mid Career (3-7 years) | $55,286 |
| Experienced (7+ years) | $67,817 |
Estimates based on BLS percentile data averaged across California metro areas. Individual pay varies by employer, certifications, and specialization.
All 158 Cities in California
| # | City | Median Salary |
|---|---|---|
| 1 | Sunnyvale | $78,749 |
| 2 | Santa Clara | $78,232 |
| 3 | San Jose | $76,942 |
| 4 | Oakland | $67,924 |
| 5 | Fremont | $66,425 |
| 6 | San Francisco | $66,412 |
| 7 | Santa Rosa | $62,493 |
| 8 | Napa | $62,162 |
| 9 | Petaluma | $61,895 |
| 10 | Vallejo | $60,853 |
| 11 | Folsom | $60,828 |
| 12 | Oxnard | $60,780 |
| 13 | Thousand Oaks | $60,535 |
| 14 | Sacramento | $60,419 |
| 15 | Santa Cruz | $60,419 |
| 16 | Roseville | $60,171 |
| 17 | Chula Vista | $60,014 |
| 18 | San Diego | $59,945 |
| 19 | Carlsbad | $59,444 |
| 20 | San Luis Obispo | $58,945 |
| 21 | Salinas | $58,573 |
| 22 | El Centro | $57,810 |
| 23 | Santa Ana | $56,072 |
| 24 | Fontana | $55,034 |
| 25 | Irvine | $54,974 |
| 26 | Pomona | $54,705 |
| 27 | Simi Valley | $54,676 |
| 28 | Escondido | $54,662 |
| 29 | Fairfield | $54,564 |
| 30 | Fullerton | $54,363 |
| 31 | Daly City | $54,317 |
| 32 | El Monte | $54,299 |
| 33 | Vista | $54,269 |
| 34 | Concord | $54,257 |
| 35 | Clovis | $54,175 |
| 36 | Garden Grove | $54,120 |
| 37 | Temecula | $54,106 |
| 38 | Santa Clarita | $54,070 |
| 39 | Lancaster | $54,000 |
| 40 | Inglewood | $54,000 |
| 41 | Corona | $53,932 |
| 42 | Richmond | $53,923 |
| 43 | Rialto | $53,897 |
| 44 | Torrance | $53,829 |
| 45 | Elk Grove | $53,727 |
| 46 | Oceanside | $53,713 |
| 47 | Whittier | $53,698 |
| 48 | San Rafael | $53,694 |
| 49 | Rancho Cucamonga | $53,645 |
| 50 | Hayward | $53,615 |
| 51 | Woodland | $53,601 |
| 52 | Buena Park | $53,593 |
| 53 | Encinitas | $53,588 |
| 54 | Downey | $53,585 |
| 55 | Dublin | $53,555 |
| 56 | Redlands | $53,538 |
| 57 | Chino | $53,509 |
| 58 | Westminster | $53,493 |
| 59 | Santa Monica | $53,488 |
| 60 | San Mateo | $53,482 |
| 61 | Tulare | $53,467 |
| 62 | San Buenaventura | $53,448 |
| 63 | Moreno Valley | $53,412 |
| 64 | Mission Viejo | $53,412 |
| 65 | Pleasanton | $53,404 |
| 66 | Pasadena | $53,329 |
| 67 | Santee | $53,291 |
| 68 | Glendale | $53,243 |
| 69 | Mountain View | $53,215 |
| 70 | Pittsburg | $53,211 |
| 71 | Novato | $53,194 |
| 72 | Costa Mesa | $53,175 |
| 73 | Berkeley | $53,119 |
| 74 | Huntington Beach | $53,106 |
| 75 | Jurupa Valley | $53,059 |
| 76 | Hemet | $53,044 |
| 77 | Union City | $53,040 |
| 78 | West Covina | $53,034 |
| 79 | Chino Hills | $53,018 |
| 80 | Gilroy | $52,943 |
| 81 | Santa Maria | $52,921 |
| 82 | San Marcos | $52,914 |
| 83 | Tustin | $52,868 |
| 84 | San Ramon | $52,863 |
| 85 | Eastvale | $52,813 |
| 86 | Murrieta | $52,811 |
| 87 | Vacaville | $52,811 |
| 88 | Brentwood | $52,788 |
| 89 | Hesperia | $52,763 |
| 90 | Lake Elsinore | $52,758 |
| 91 | Citrus Heights | $52,691 |
| 92 | El Cajon | $52,645 |
| 93 | San Clemente | $52,629 |
| 94 | Bellflower | $52,608 |
| 95 | Palmdale | $52,585 |
| 96 | La Mirada | $52,584 |
| 97 | Apple Valley | $52,575 |
| 98 | Menifee | $52,559 |
| 99 | Yucaipa | $52,536 |
| 100 | Norwalk | $52,533 |
| 101 | Rancho Cordova | $52,486 |
| 102 | Montebello | $52,436 |
| 103 | Compton | $52,415 |
| 104 | Porterville | $52,378 |
| 105 | Lompoc | $52,370 |
| 106 | Hawthorne | $52,289 |
| 107 | Antioch | $52,272 |
| 108 | Burbank | $52,268 |
| 109 | Alhambra | $52,147 |
| 110 | Livermore | $52,147 |
| 111 | Orange | $52,131 |
| 112 | South Gate | $52,130 |
| 113 | Victorville | $52,119 |
| 114 | West Sacramento | $52,100 |
| 115 | Poway | $52,087 |
| 116 | San Leandro | $52,017 |
| 117 | Indio | $51,958 |
| 118 | Lake Forest | $51,958 |
| 119 | Carson | $51,866 |
| 120 | Rocklin | $51,858 |
| 121 | Newport Beach | $51,769 |
| 122 | Redwood City | $51,765 |
| 123 | Turlock | $51,753 |
| 124 | Modesto | $51,745 |
| 125 | Manteca | $51,736 |
| 126 | Perris | $51,732 |
| 127 | Madera | $51,690 |
| 128 | Fresno | $51,611 |
| 129 | Yuba City | $51,601 |
| 130 | Baldwin Park | $51,598 |
| 131 | Palo Alto | $51,598 |
| 132 | Lakewood | $51,577 |
| 133 | Hanford | $51,549 |
| 134 | Beaumont | $51,426 |
| 135 | Tracy | $51,413 |
| 136 | Alameda | $51,397 |
| 137 | Laguna Niguel | $51,384 |
| 138 | Milpitas | $51,359 |
| 139 | Camarillo | $51,250 |
| 140 | Oakley | $51,229 |
| 141 | Davis | $51,216 |
| 142 | Upland | $51,178 |
| 143 | La Habra | $51,103 |
| 144 | Lynwood | $51,082 |
| 145 | Ontario | $50,697 |
| 146 | Stockton | $50,631 |
| 147 | Brea | $50,211 |
| 148 | San Bernardino | $50,085 |
| 149 | Merced | $50,044 |
| 150 | Riverside | $50,023 |
| 151 | Redding | $50,013 |
| 152 | Lodi | $49,933 |
| 153 | Chico | $49,683 |
| 154 | Bakersfield | $49,610 |
| 155 | Anaheim | $49,234 |
| 156 | Long Beach | $48,534 |
| 157 | Los Angeles | $48,373 |
| 158 | Visalia | $48,094 |
More California Salary Data
Hourly Rates
Explore dental assistant hourly pay in California cities.
Senior / Experienced
Top earner salaries for experienced dental assistants.
Compare Cities in California
View all comparisons →Explore More Dental Assistant Salary Data
Frequently Asked Questions
How much do dental assistants make in California in 2026?
What is the highest paying city for dental assistants in California?
How does California dental assistant pay compare to the national average?
What is the entry-level dental assistant salary in California?
How many dental assistants are employed in California?
Which California city offers the best value for dental assistants?
Written by Maria Gonzalez, CDA, RDH
Career Analyst
Maria Gonzalez has over 10 years of experience in dental assisting. She specializes in pediatric dentistry. She works in a private dental practice.
Methodology & Data Source
Statewide salary figures on this page are 2026 projections based on the Bureau of Labor Statistics Occupational Employment and Wage Statistics (OEWS) survey, May 2026 release. A 3.14% compound annual growth rate (CAGR), derived from 6-year national BLS wage trends, was applied to each metro area's reported salary to estimate current 2026 dental assistant compensation across California. State averages are employment-weighted across 158 metro areas — larger metro areas with more dental assistantscontribute proportionally more to the average, producing figures that better reflect typical compensation. Individual pay varies by city, employer, certifications, and experience.
Data Sources & Methodology
Source: BLS, OEWS, 7-year dataset (–). Per-city data from annual BLS metropolitan area surveys.
2026 figures are projected from 2025 BLS data using a compound annual growth rate (CAGR) of 3.14%, derived from historical BLS wage trends for dental assistants (SOC 31-9091).
Compiled and verified by Maria Gonzalez, CDA, RDH, a licensed dental assistant with 10+ years of clinical experience. · View source data at BLS.gov